

Cleaning Stock Dividend Data Using Pandas and Calculating Dividend Factor!
The only implementation you will find on the Internet!


Welcome Readers 🤩 to the fifth article in the series "NSE EOD Stock Prices." This article will discuss how to use the pandas library to clean the Dividends Data we downloaded from the Bombay Stock Exchange in the last article here.. If you haven't read the previous articles in the series, I would recommend you to read them.
For readers who were not able to download the files due to technical issues with the BSE website, you can download the sample dividend file by clicking here. This will help you to follow me on this article.
Before starting, I am assuming you know why we need to adjust our stock price data for dividends; if not, please check out the Zerodha Article here.
This article is split into two parts:
Cleaning Dividends Dataset: We use basic pandas operations to arrive at a column
div_valueCalculating Dividend Factor: We use the original price dataset to calculate this, discuss the formula in this section, and generate a
dividend_factorcolumn.
Cleaning Dividends Dataset
The data I am using contains all dividend information from Jan 2016 - March 2021. I will be posting screenshots of Jupyter Notebook so that it's easier to follow, but if you need just the code, please check out Github here.
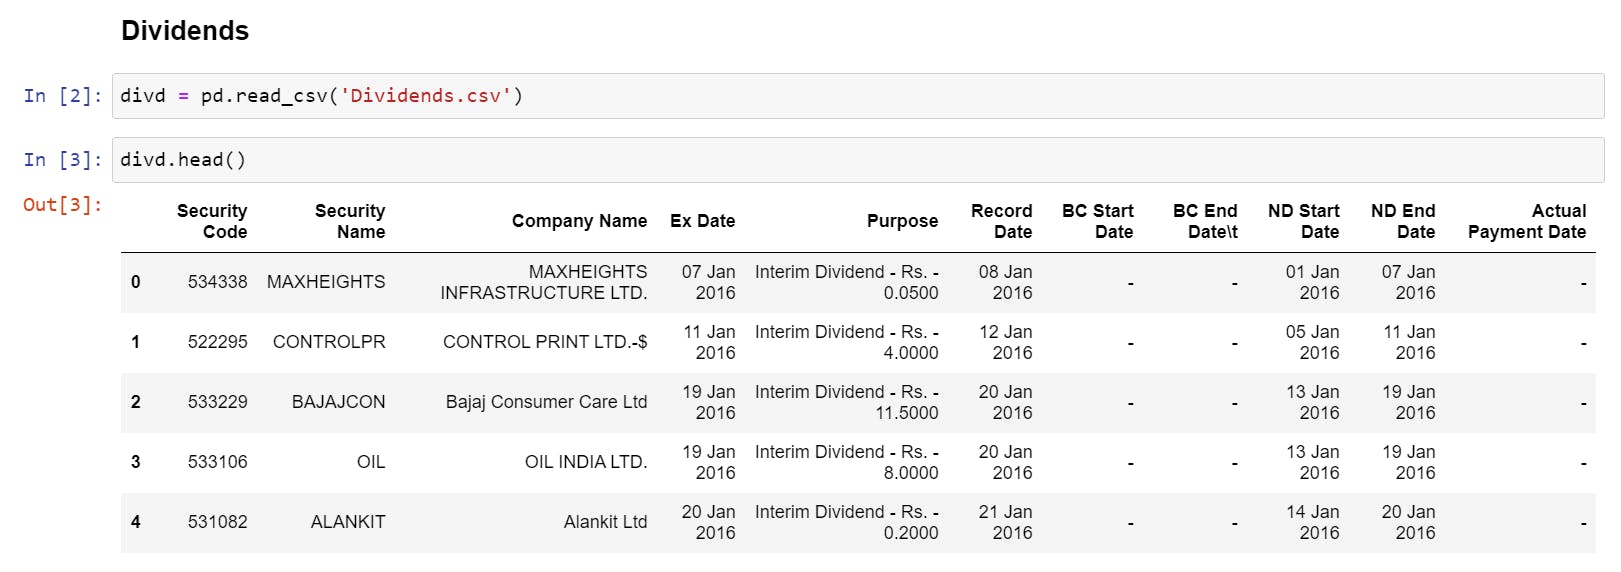
- Loading the Data and Checking the first 5 rows. You will notice we have too many unnecessary columns; realistically, we only need Security Name, Ex-Date, and Purpose.
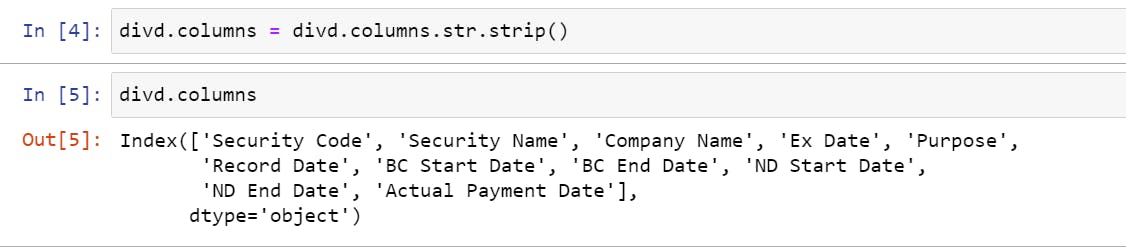
- Stripping all the column headers of any whitespaces, i.e., converting " Security Code" to "Security Code."
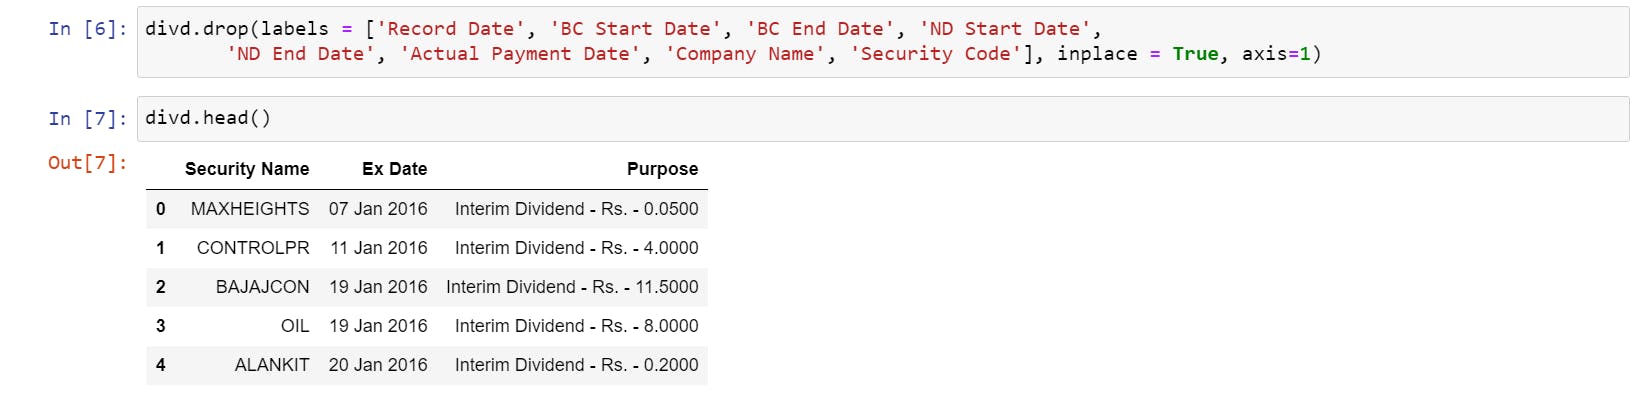
**Dropping All Unnecessary columns and keeping the essentials. **
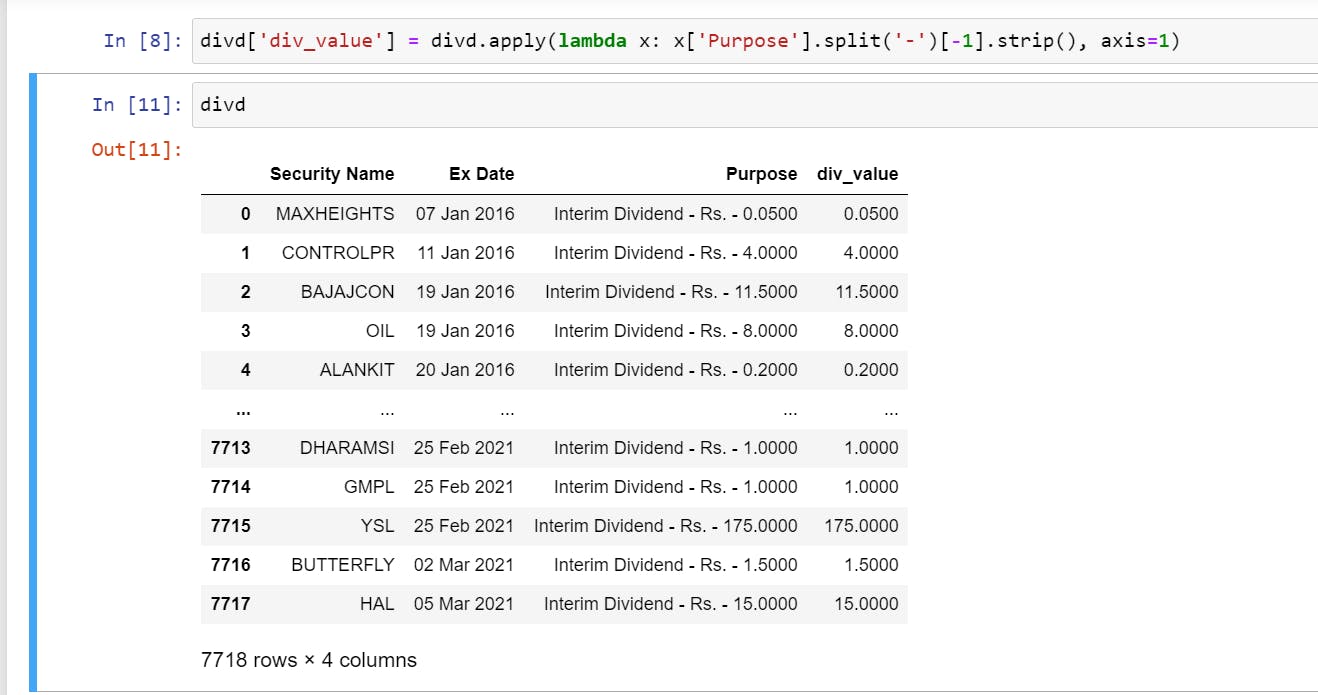
Now Extracting the numeric dividend value from the purpose column, since every row in the purpose column is a string, we notice a common theme, every numeric value is after a hyphen (-), so we split the string on hyphen and then take the last numeric value. We then assign this value to a new column
div_value
- ** Let's export this data to CSV** to do a sense check that our
div_valuecolumn has values populated accurately. We do this before because in the next step, we will be converting all thesestrvalues tofloatdata type, and if there is any row that does not have a number, we need to deal with it. Applying a quick filter to thediv_valuecolumn, you will notice we have a couple of entries with no numbers.
divd.to_csv('dividends_check.csv')
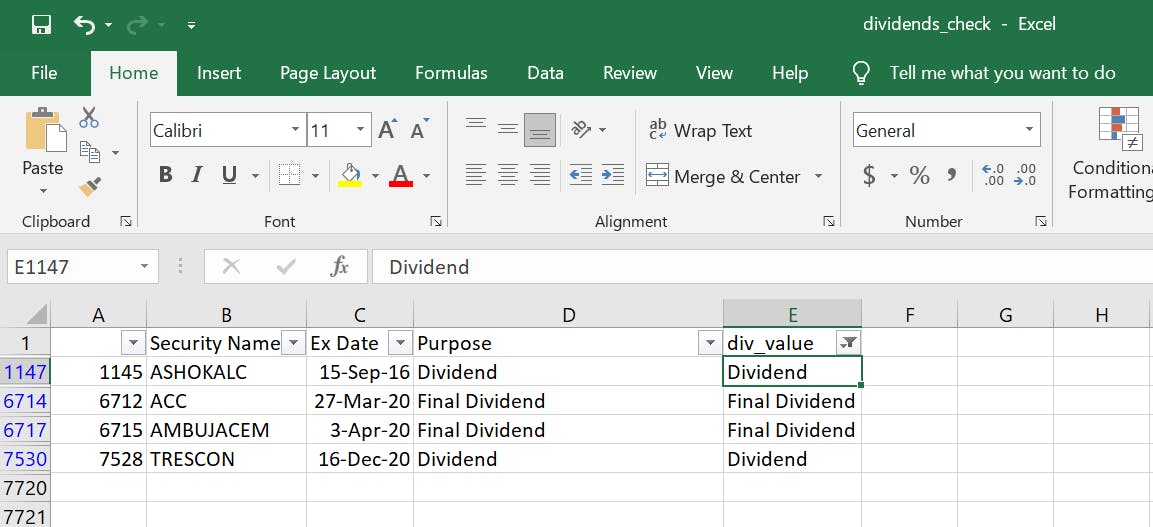
The above was not because our code was wrong; it's because the extract from the BSE website actually does not contain this data; Notice the Purpose column, which does not have any number. These things happen with Corporate Action data; as I mentioned before, it cannot be completely automated, and from time to time, you will have to manually adjust things, like the entries above.
So, how do we deal with this data? We will exclude it from our dataset, or you can check the public sources and mention the correct dividend value. My preference is to make them null values.
- Converting all dividend values to floats and substituting non-float values with
None, we will write a simpleconvert_floatfunction to do this task.
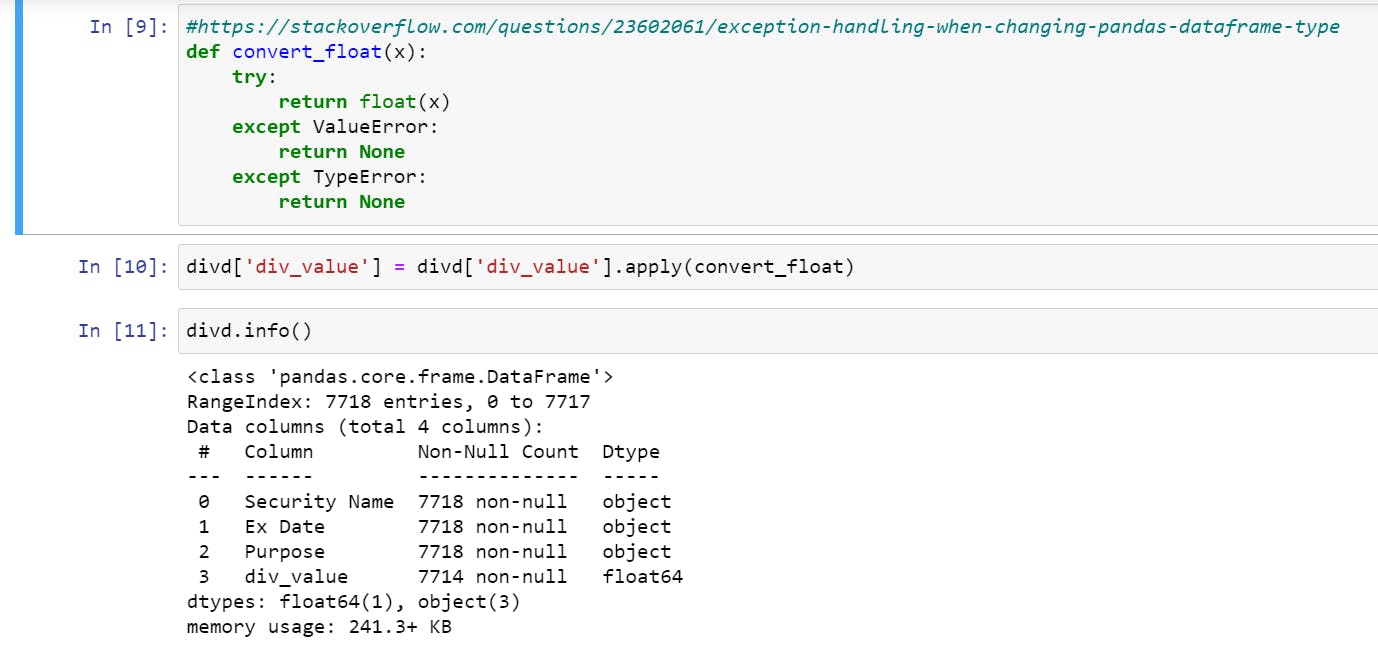
Notice, in the info output above; the column div_value has 7714 values instead of 7718; this is because those 4 values have been converted to null.
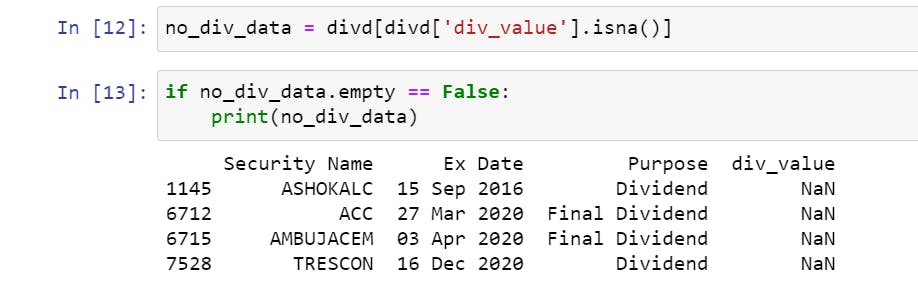
- Quickly verifying the null value rows to see if it matches the Excel spreadsheet filtering we did earlier.
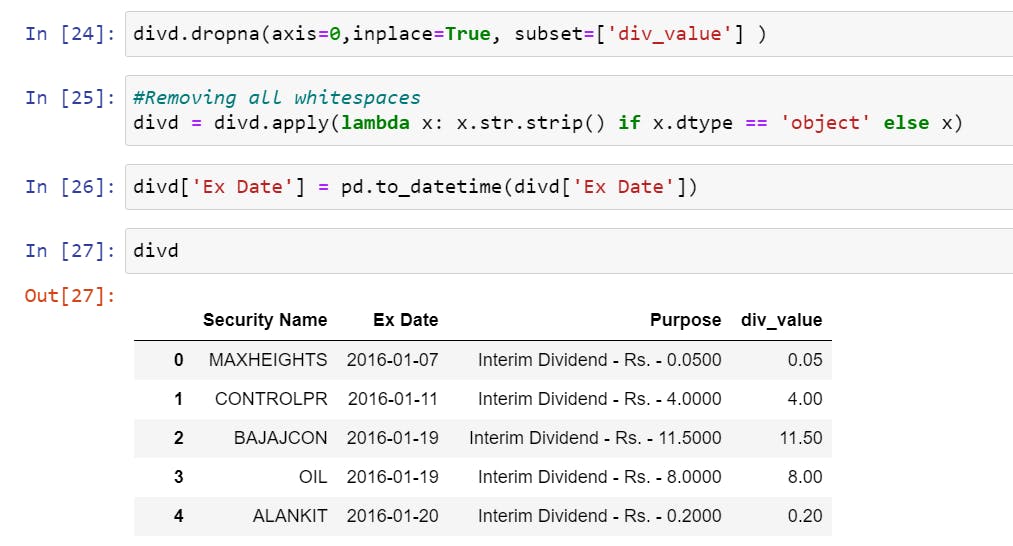
- Dropping these null rows and removing all whitespaces from all string-based rows. Finally, also converting the
Ex Datecolumn to adatetimedata type.
Calculating Dividend Factor
I will be honest, it took me a long time to figure this one out, unusually long actually, but the solution is straightforward. To understand the solution, we first need to talk about the methodology I learned from one of the Yahoo Finance support pages.
Expand the Sample Calculation and Multipliers point on this link to understand it.
Basically, have you ever thought of what happens if a company pays a dividend that is more than its current share price? Will the stock price go in the negative? That doesn't make sense. A company cannot be valued negatively; it can go to zero, but not in negatives. So CRSP came up with a methodology to adjust for dividends as per below.
$$[1 - (Dividend/ClosingPriceBeforeExDate )]$$
So taking Yahoo Finance Example: If a $0.08 cash dividend is distributed on Feb 19 (ex-date), and the Feb 18 closing price is $24.96, the pre-dividend data is multiplied by (1-0.08/24.96) = 0.9968.
We should then multiply this 0.9968 with all OHLC prices before the ex-date, but we will not be covering that in this article; this article's scope is to calculate the factor, i.e., 0.9968.
So like you may have figured out already, we would need the actual price data to calculate the dividend factors, you can download all price data adjusted for symbol changes for 2016-2020 by clicking here.
- Loading the Price data using Pandas into a dataframe called
price_df
price_df = pd.read_csv('path/to/downloaded/file/nse_prices_final_2020.csv')
price_df.set_index('TIMESTAMP', inplace=True)
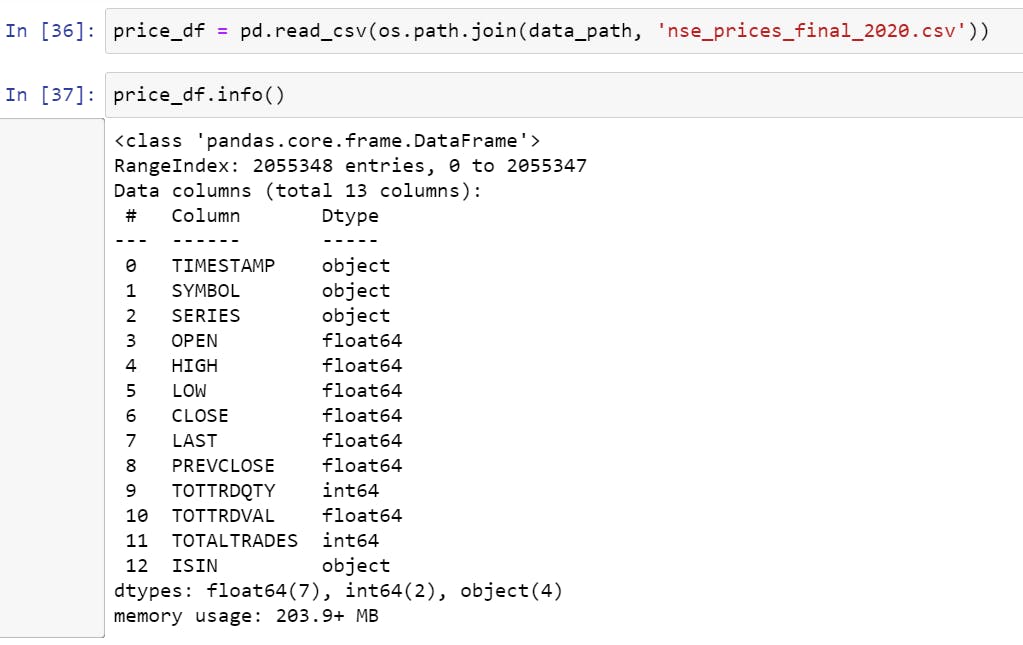
That's a big dataset with 2 million+ rows. If your machine has less RAM, feel free to split the data into multiple years.
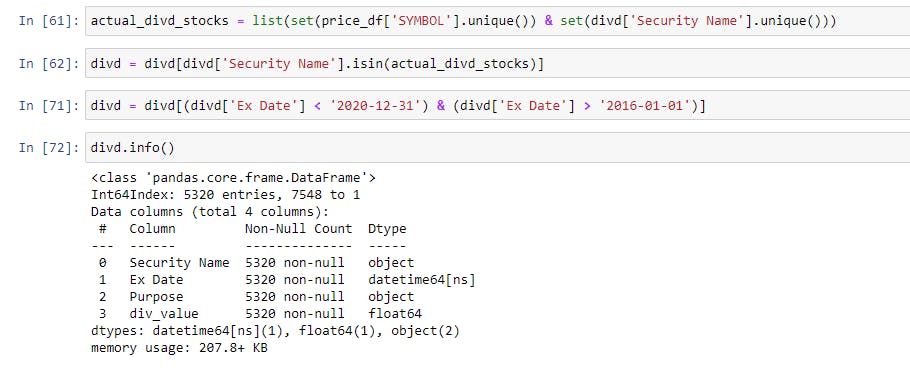
Filtering the Dividend Data only for stocks present in price_df and filtering the data for dates between 2016-2020. The reason we have to filter the dividend data for the stocks that we have prices for is that the dividend data is extracted from the BSE, and we have price data from NSE; BSE has far more listed companies than NSE for which we have no data for and need not be adjusted.
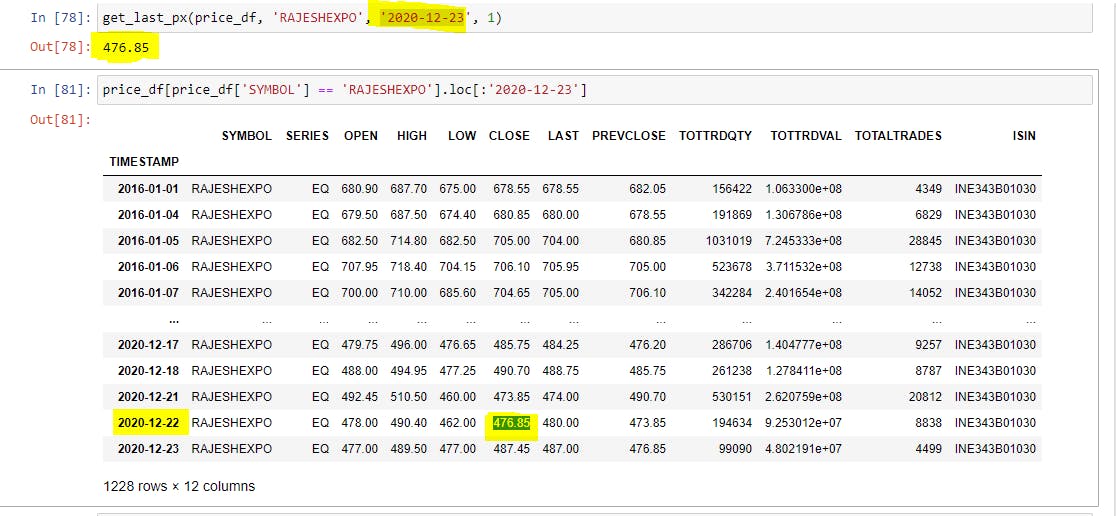
- Building a function which would get the last closing price before Ex-Date
def get_last_px(df, name, date, div_amt):
    try:
        last_px = df[df['SYMBOL'] == name].loc[:date].iloc[-2]['CLOSE']
    except IndexError:
        last_px = div_amt

    return last_px
Let's quickly verify if the function gives us the correct price or not; I have checked for RAJESHEXPO, which gave a dividend of 1 Re on 23-12-2021.
- Finally, applying this function to each row of the Dividend Dataframe
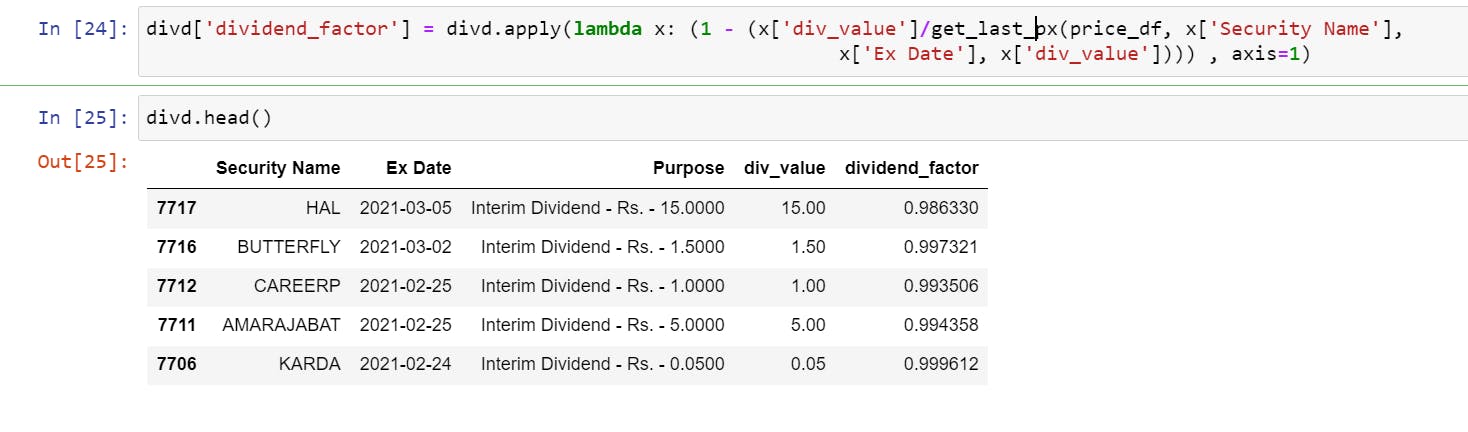
Note, depending
And that's it, readers👯♂️, I can bet you will not find a detailed implementation on how to calculate dividend factors programmatically anywhere on the internet, the reason being it involves a lot of things to be mindful of and is not an easy topic to explain.
I hope I have done some justice in explaining it; if not, please drop a line with feedback; I would highly appreciate it. If you are stuck at any stage, reach out to me on Linkedin or Twitter.
The next article will be on cleaning data for Splits & Bonus and calculating their adjustment factors; they are much easier than dividends.
Update: This article is now live and can be accessed here:
I will soon begin building my Youtube channel which will have all the content present on this blog in form of videos, to support me, you can buy me a coffee by clicking here or on the button below.