

Creating Twitter Sentiment Analyzer using Python to gather insights on Stocks


Sentiment analysis has recently surged in popularity as it allows one to know the intent behind the data scraped. The intent is classified as positive, negative, or neutral. As and when the data is scraped from social media and assigned with a score, this process is named "Sentiment Analysis". Simply put, mining the general public's opinion on a specified ticker/company is called Financial Sentiment Analysis.
In this tutorial, you'll learn the amazing capabilities of:
VADER(Valence Aware Dictionary and Sentiment), which is a lexicon(glossary) and rule-based sentiment analysis tool that is specifically attuned to sentiments expressed on social media.
snscrape, which is a scraper for social networking services (SNS). It scrapes things like user profiles, hashtags, or searches and returns the discovered items, e.g., the relevant posts.
Although Scraping tweets requires Twitter's Developer Account and Application Programming Interface (API) keys for getting authenticated on Twitter but thanks to snscrape, which does this work without the API keys. Yup, we want things to be easy for you. 😀
Just to get started, have a look at this example:
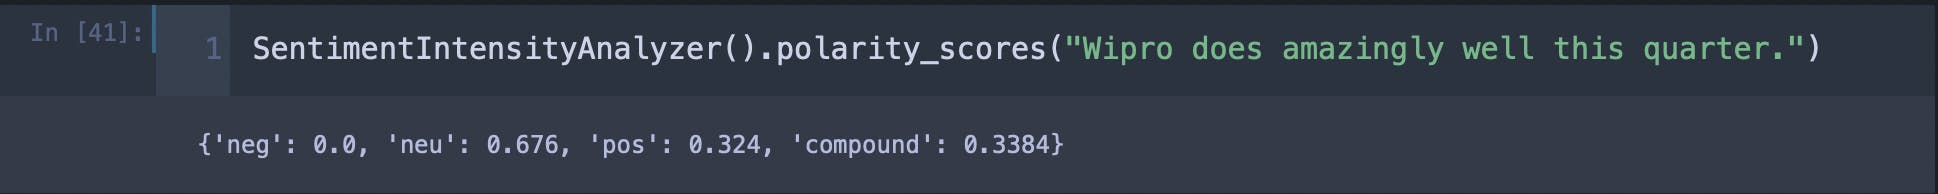
Here, neg refers to negative, nue to neutral, and pos to positive. The compound score is calculated by taking the sum of all the lexicon(glossary) ratings which have been normalized between -1(most extreme negative) and +1 (most extreme positive). Still, you should not worry about it a lot as it is not suitable for our use case. All values range from 1 to -1. The first three scores combined equal 1.
Now think of scraping thousands of tweets in one go and running sentiment analysis on those scraped tweets to know the general public's opinion on a particular stock or a ticker. We're going to run this analysis on every single tweet that we'll be scraping from Twitter, and the most amazing is that we can visualize it like this:

Exciting, isn't it?
The Python Implementation
Before we get into the main code, some mandatory legal text.
Disclaimer: The material in this article is purely educational and should not be taken as professional investment advice. The idea of this simple article is just to get you started and to showcase the possibilities with Python.
1. Installing the required libraries
In your Anaconda console, just type in the below commands to install the libraries required for this project.
pip install wordcloudpip install snscrapepip install nltk

2. Importing the libraries
import numpy as np
import pandas as pd
import matplotlib.pyplot as plt
import datetime as dt
import re
from wordcloud import WordCloud, STOPWORDS
from nltk.sentiment.vader import SentimentIntensityAnalyzer
import snscrape.modules.twitter as sntwitter
import nltk

nltk.download('vader_lexicon') #required for Sentiment Analysis
Here, STOPWORDS a list of really common words, like articles, pronouns, prepositions, and conjunctions. We do not want these generic words to be included in the WordCloud we showed as a sample above, so we will be excluding them.
re is a regular expression that specifies a set of strings that matches it. It is very powerful but can feel tricky at the very start. You can check out this article by W3Schools to read more about it.
3. Let's Scrape!
#Get user input
query = input("Query: ")

#As long as the query is valid (not empty or equal to '#')...
if query != '':
    noOfTweet = input("Enter the number of tweets you want to Analyze: ")
    if noOfTweet != '' :
        noOfDays = input("Enter the number of days you want to Scrape Twitter for: ")
        if noOfDays != '':
                #Creating list to append tweet data
                tweets_list = []
                now = dt.date.today()
                now = now.strftime('%Y-%m-%d')
                yesterday = dt.date.today() - dt.timedelta(days = int(noOfDays))
                yesterday = yesterday.strftime('%Y-%m-%d')
                for i,tweet in enumerate(sntwitter.TwitterSearchScraper(query + ' lang:en since:' +  yesterday + ' until:' + now + ' -filter:links -filter:replies').get_items()):
                    if i > int(noOfTweet):
                        break
                    tweets_list.append([tweet.date, tweet.id, tweet.content, tweet.username])

                #Creating a dataframe from the tweets list above
                df = pd.DataFrame(tweets_list, columns=['Datetime', 'Tweet Id', 'Text', 'Username'])

                print(df)
The end dataframe should print like this in your console.
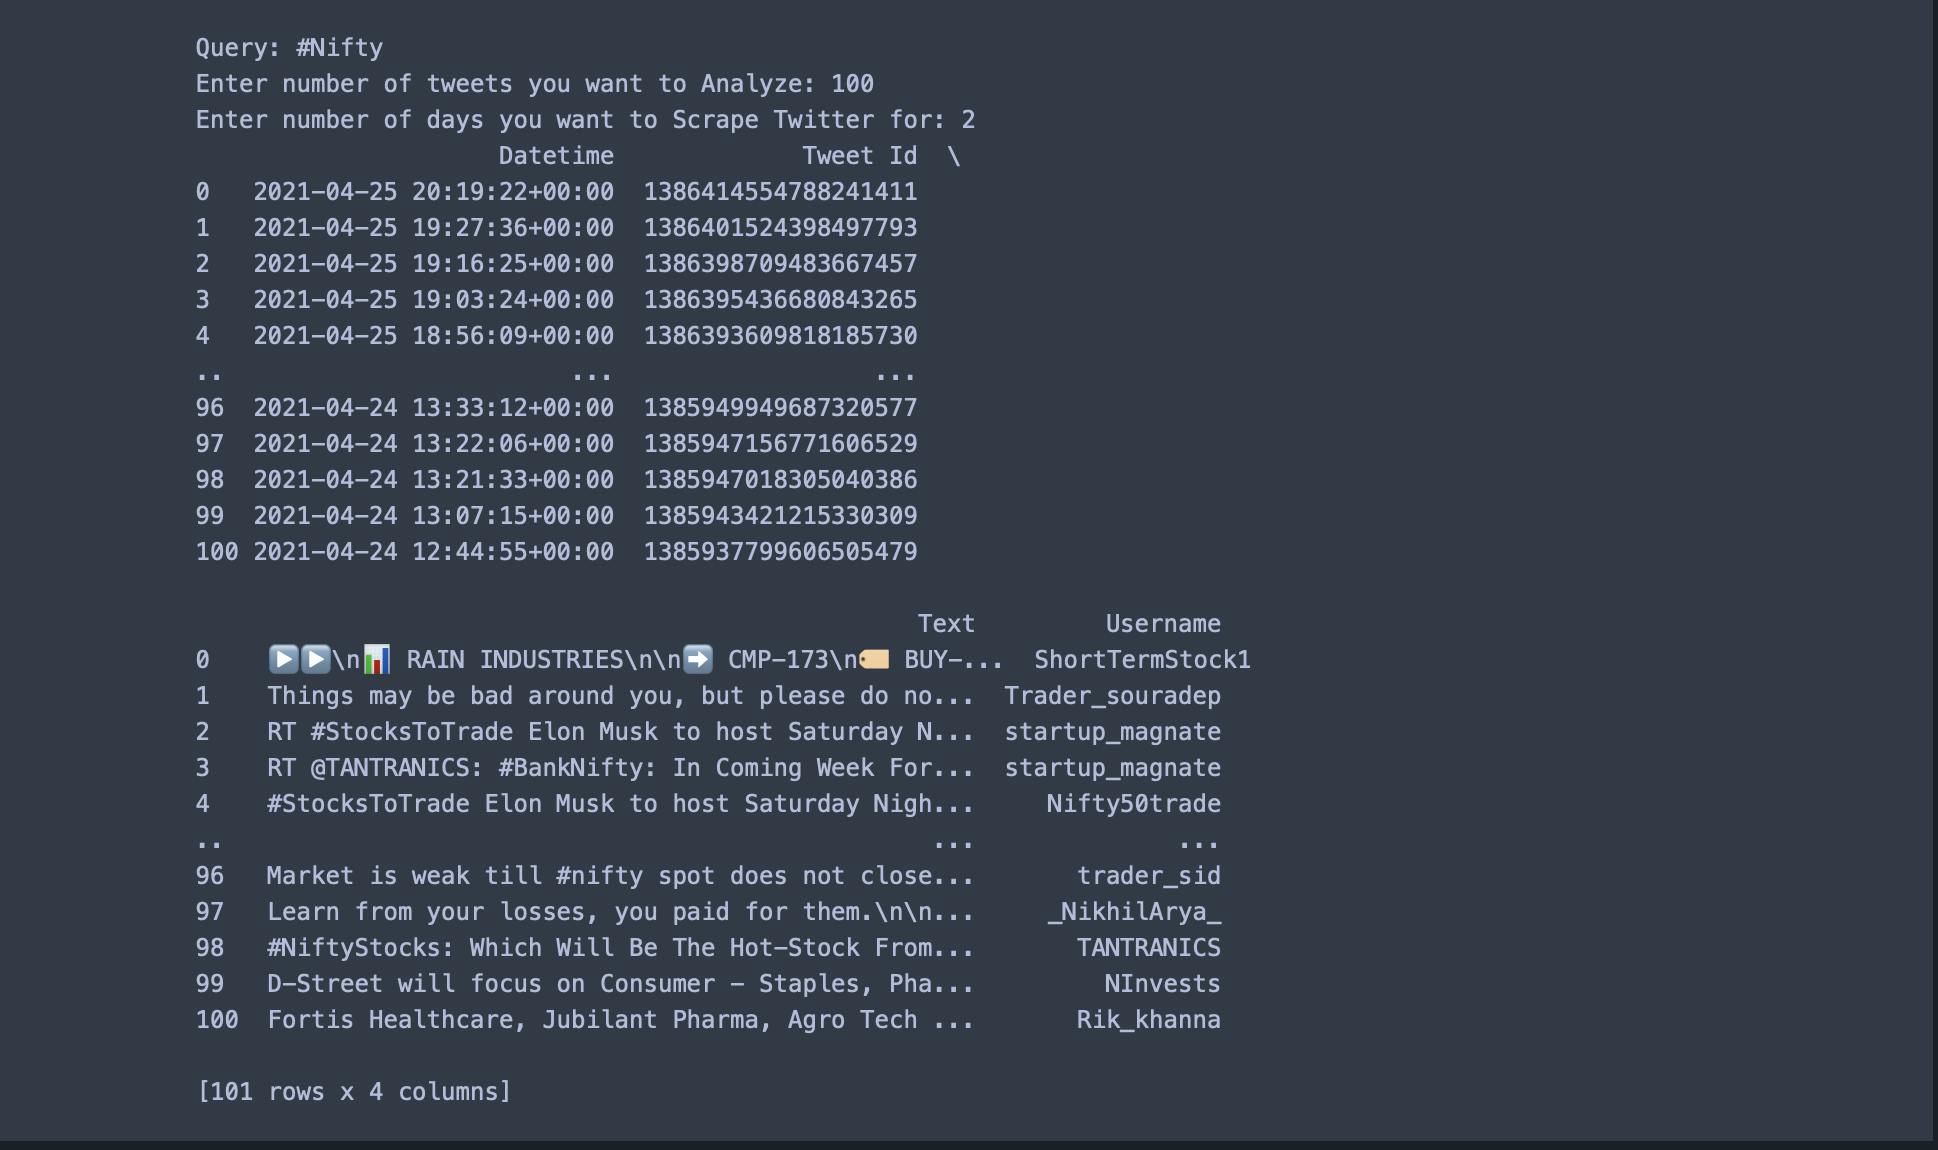
The above implementation uses #NIFTY to scrape 100 tweets over the last 2 days as an example; if you would like to see the same, you can open this Google Colab Notebook.
4. Sentiment Analysis
Now that we've scraped Twitter for a particular ticker, we will analyze each tweet by assigning them the scores.
Creating a function to clean the tweets:
# Create a function to clean the tweets
def cleanTxt(text):
    text = re.sub('@[A-Za-z0–9]+', '', text) #Removing @mentions
    text = re.sub('#', '', text) # Removing '#' hash tag
    text = re.sub('RT[\s]+', '', text) # Removing RT
    text = re.sub('https?:\/\/\S+', '', text) # Removing hyperlink
    return text

#applying this function to Text column of our dataframe
df["Text"] = df["Text"].apply(cleanTxt)
We've cleaned the scraped tweets so that VADER can identify the sentiment more accurately. After Cleaning the tweets, let's run sentiment analysis on every tweet.
#Sentiment Analysis
def percentage(part,whole):
    return 100 * float(part)/float(whole)

#Assigning Initial Values
positive = 0
negative = 0
neutral = 0
#Creating empty lists
tweet_list1 = []
neutral_list = []
negative_list = []
positive_list = []

#Iterating over the tweets in the dataframe
for tweet in df['Text']:
    tweet_list1.append(tweet)
    analyzer = SentimentIntensityAnalyzer().polarity_scores(tweet)
    neg = analyzer['neg']
    neu = analyzer['neu']
    pos = analyzer['pos']
    comp = analyzer['compound']

    if neg > pos:
        negative_list.append(tweet) #appending the tweet that satisfies this condition
        negative += 1 #increasing the count by 1
    elif pos > neg:
        positive_list.append(tweet) #appending the tweet that satisfies this condition
        positive += 1 #increasing the count by 1
    elif pos == neg:
        neutral_list.append(tweet) #appending the tweet that satisfies this condition
        neutral += 1 #increasing the count by 1

positive = percentage(positive, len(df)) #percentage is the function defined above
negative = percentage(negative, len(df))
neutral = percentage(neutral, len(df))
If you face any difficulty copying the code from here, head over to the Google Colab Notebook.
So what we're actually doing here?
We first created a function percentage to covert the tweets into a percentage, and then we ran sentiment analysis on every single tweet in our dataframe df; towards the end, we have written a logic that
If the negative score for a tweet is more than the positive score, we'll consider it a negative tweet.
If the positive score for a tweet is greater than the negative score, we'll consider it a positive tweet.
For neutral, we've written that if positive equals negative, then only we'll consider it to be a neutral tweet. We've done this because the VADER assigns a neutral score to the tweets frequently so, to minimize the impact of this, we've written this logic.
5. Visualizing the data
**Pie-Chart : **
#Converting lists to pandas dataframe
tweet_list1 = pd.DataFrame(tweet_list1)
neutral_list = pd.DataFrame(neutral_list)
negative_list = pd.DataFrame(negative_list)
positive_list = pd.DataFrame(positive_list)
#using len(length) function for counting
print("Since " + noOfDays + " days, there have been", len(tweet_list1) ,  "tweets on " + query, end='\n*')
print("Positive Sentiment:", '%.2f' % len(positive_list), end='\n*')
print("Neutral Sentiment:", '%.2f' % len(neutral_list), end='\n*')
print("Negative Sentiment:", '%.2f' % len(negative_list), end='\n*')
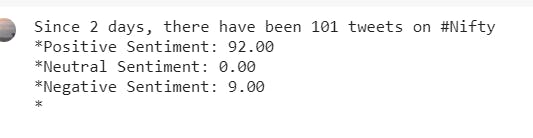
We have done this analysis for 25 - 26 April 2021, so by the time you are reading it, the sentiment might change.
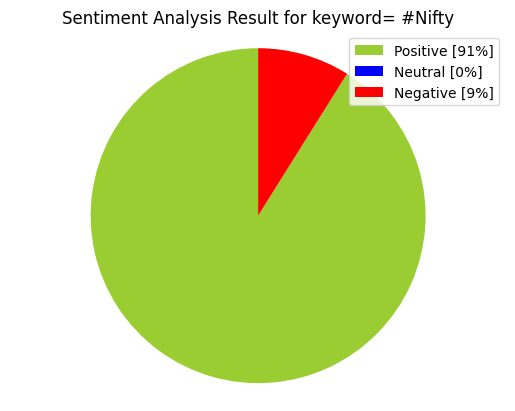
**#Creating PieCart**

labels = ['Positive ['+str(round(positive))+'%]' , 'Neutral ['+str(round(neutral))+'%]','Negative ['+str(round(negative))+'%]']
sizes = [positive, neutral, negative]
colors = ['yellowgreen', 'blue','red']
patches, texts = plt.pie(sizes,colors=colors, startangle=90)
plt.style.use('default')
plt.legend(labels)
plt.title("Sentiment Analysis Result for keyword= "+query+"" )
plt.axis('equal')
plt.show()
Output:
Word Cloud:
# word cloud visualization
def word_cloud(text):
    stopwords = set(STOPWORDS)
    allWords = ' '.join([twts for twts in text])
    wordCloud = WordCloud(background_color='black',width = 1600, height = 800,stopwords = stopwords,min_font_size = 20,max_font_size=150,colormap='prism').generate(allWords)
    fig, ax = plt.subplots(figsize=(20,10), facecolor='k')
    plt.imshow(wordCloud)
    ax.axis("off")
    fig.tight_layout(pad=0)
    plt.show()

print('Wordcloud for ' + query)
word_cloud(df['Text'].values)
**Output: **

Here, When we display the word cloud using matplotlib it is scaled to the size of the plot canvas, which is (by default) around 800x600, and you lose the quality of the image that is generated. To fix this, we've specified the size of the figure is adjusted before you call imshow, e.g. plt.figure( figsize=(20,10))
6. Wrapping it up
Now that you have seen how sentiments can drive the market. You can create your own trading strategy using sentiment analysis. I hope you had a good read and learned a couple of things on how the whole process works like and we at TradeWithPython can't wait to see what you build with these ideas! You can also access the Github link here to view the whole code in one single file directly.
I hope you enjoyed this article. I shall be covering Sentiment analysis of News Headlines in the next article, so stay tuned :)
Please feel free to leave a comment and connect if you have any questions regarding this or require any further information, and consider subscribing to my mailing list for automatic updates on future articles. 📬
If you want to reach out, you can connect with me via Mail or you can find me on Linkedin
If you liked this article, consider buying me a book 📖 by clicking here or the button below.