A lot of traders/investors now have come to know the importance of backtesting a particular strategy; although past returns are no guarantee of future returns, backtesting does give you a good judgment call on what might happen in the future. But as with any data-related problem you are solving, if you are feeding in the garbage to your strategy for backtesting purposes, the results that you will get will be garbage. This is called GIGO (Garbage In Garbage Out). In Backtesting, you need to adjust your historical data for various data biases for it to make sense. Otherwise, your backtesting results are equivalent to interpreting garbage.
Before going to Data Bias, let us quickly look at Backtesting if you are not aware of it already. And answer a basic question What is Backtesting? How it is important?
Backtesting is the general method for seeing how well a strategy or model would have done ex-post. Backtesting assesses the viability of a trading strategy by discovering how it would play out using historical data. If backtesting works, traders and analysts may have the confidence to deploy it going forward.
Usually, an erroneous or biased backtest would produce a better or worse historical performance than what we would have obtained in actual trading.
Now, let's jump to the Various Data Biases that impact Back Testing.
Data Biases in Historical Financial Databases
Survivorship Bias
Survivorship bias or survivor bias tends to view the performance of existing stocks or funds in the market as a comprehensive representative sample without regarding those that have gone bust.
Survivorship bias is a natural peculiarity that increases the visibility of existing funds in the financial industry, making them more highly regarded as a representative sample. It occurs when an investment manager closes several funds in the investment market for various reasons, leaving existing funds at the forefront of the investing universe.
Too heavy words to understand right, Let us look at some examples for better understanding.
Example 1
In 2020, A trader had a portfolio of stocks, bonds, and mutual funds. Now for 2021, bonds were removed from the portfolio because of poor results.
Now, the portfolio only consists of stocks and mutual funds.
Suppose you compute the portfolio's performance in those two years solely based on stocks and mutual funds, without considering the low performance of bonds. In that case, the outcome in 2020 will undoubtedly be influenced by survivorship bias. It is also possible that equities and mutual funds will perform poorly in the future.
This is very similar to when you are raving about that Bitcoin investment of yours without telling your friends about all the extra money you have lost in other random coins.
Example 2
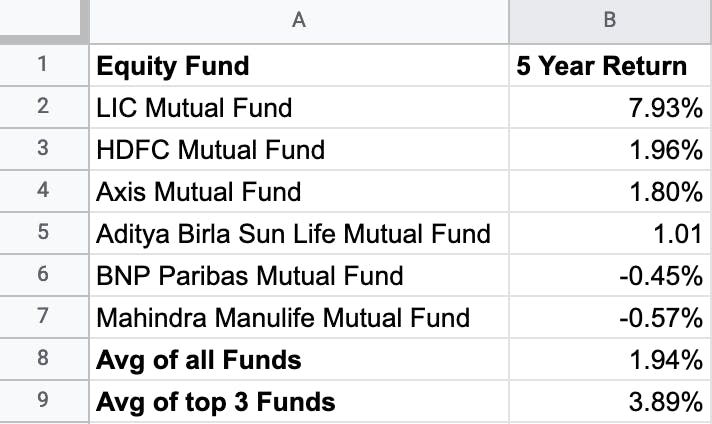
Let us take another example assuming that you invested in 5 mutual funds and your portfolio's 5-year return in the year 2021 is as follows:

Note: Data is for representational purposes only; my personal portfolio doesn't give such a bad performance.
You discovered that your net return was 1.94 percent when you took the average of all funds. On the other hand, if you look at the average of the first three best-performing funds, it turns out that the average is 3.89 percent, which is significantly higher than 1.94 percent.
If you base your future investment decisions solely on the top-performing mutual funds, you will be subject to the risk of survivorship bias.
However, the actual outcome of a 1.94 percent return indicates that you should invest in mutual funds while considering the substantial losses.
To read more about Survivorship Bias, Click here
Look Ahead Bias
Look ahead Bias is the process where one calculates a biased result because one already has some degree of knowledge of events that will later come to pass, whether minuscule or significant. This is a common problem in historical studies, rendering some of these more or less useless.
When data that was not widely available at the time is incorporated in a simulation of that time, Look Ahead Bias occurs. A Look Ahead skews the findings, leading to overconfidence in models and other frameworks built on the skew. A backtested simulation with a Look Ahead bias will not produce a reliable result.
Example
Assume you work as a quantitative analyst for a hedge fund. You're working on the creation of a new equities trading strategy. Your model examines the correlation between Stock Price and Quarterly Earnings Report.
The central assumption behind your model is that the stock price reacts to earnings reports. However, during the backtesting of the model, you assume that the company's earnings reports are released on the same date as to when the fiscal quarter closes.
Given that quarterly earnings reports are only accessible one month after the end of the quarter, this is an example of Look Ahead Bias. As a result, your backtesting includes information that was not available when the test was performed. Hence, the backtesting results are very likely to be incorrect.
We learned quite a lot from the below video by Quantra; you should totally check this short video out.
Curve Fitting Bias
The Curve Fitting (or Data Snooping) Bias is a statistical bias that appears when exhaustively searching for combinations of variables. The probability that a result arose by chance grows with the number of combinations tested.
This Bias occurs due to tweaking too many parameters to improve a system's performance on a single data set. Data Snooping, like most biases, appears to be pretty simple on the surface; nonetheless, it tends to find its way into system development inadvertently.
The best way to avoid this Bias is to keep your simulation system as simple as possible. Keep fewer parameters and run your model across various markets and periods. It is considered best to run your algorithm with unfamiliar data.
I would recommend you to give this page a read to understand more.
Data-Mining Bias
Data-Mining bias refers to an assumption of importance a trader assigns to an occurrence in the market resulting from chance or unforeseen events.
The Data-Mining Bias, for many analysts, is considered an "insidious threat" because it can sneak up on traders and analysts alike during the research processes that lead traders and investors to make the plays they make in the market.
It occurs when analysts excessively analyze data, giving rise to statistically irrelevant, sometimes non-existent trends.
Example
Imagine yourself back in college, where you had to do a final thesis on a topic chosen by you at the start of the semester. You dig deep into the data of the hypothesis you are trying to prove, but your first analysis shows that your hypothesis may be invalid or will be rejected by your professor.
Frustrated, you dig deeper and deeper into the data finding some random correlations between two variables that prove your hypothesis. This is practically Curve Fitting because we are trying to prove something that should not actually be proved. Hypothetical example: SBI's stock price increases because it allows its customers to shift their home branch virtually. Really? Isn't that too much?
To read more about Data Mining Bias, Click Here.
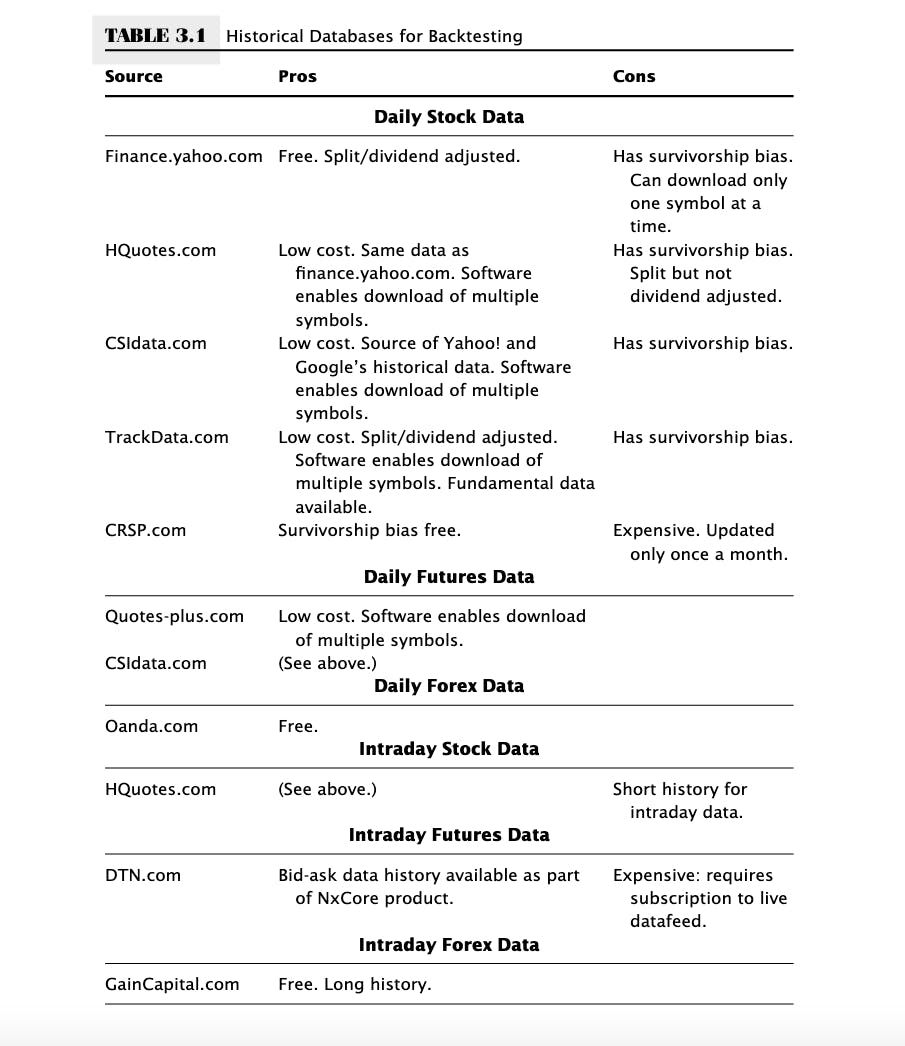
Here is a list of some common financial data sources, with their pros and cons.

Note: The table is taken from Quantitative Trading by Ernest. P Chan. You can read the complete book by clicking here
That's it. I hope you like the content. Constructive criticism is appreciated.
Feel free to reach out to me on Linkedin if you have any suggestions about the blog, you can use the Feedback widget on the right hand of your screen, and if you wish to Contact Us, you can fill in the form here.
P.s- We hope to connect with you via LinkedIn or any social media platform to discuss ideas, and feel free to subscribe to the newsletter at the top of this article. If you liked this article, you could also buy me a book to show some appreciation. 😇
